Increasing EA incidence by SEER registry
Last week I posted figures summarizing changes in age-adjusted incidence rates of esophageal adenocarcinoma (EA) over the past 20 years according to demographic characteristics, using the latest data from 14 population-based registries in NCI's SEER program (https://www.esocan.org/ea-rates-increasing/).
This post focuses on changes in incidence by individual registries in white males (the highest risk group and the only group with increasing rates) from 2000 – 2019 from the same 14 registries. As before, the “smoother” used in these figures is a 3rd degree polynomial, which is similar to the lowess smoother in this situation.
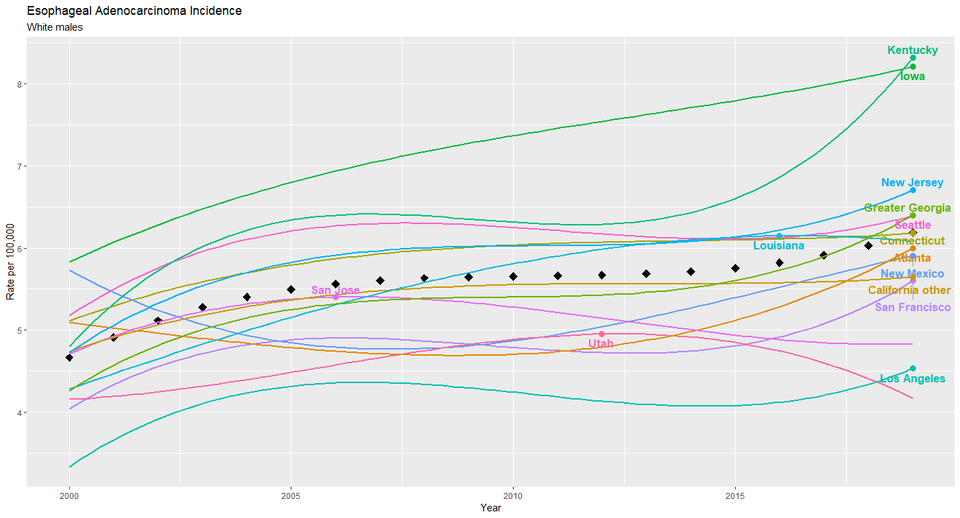
In Figures 1 and 2, the black diamonds represent (smoothed) rates for all 14 registries. The registry labels are positioned above the peak of each registry’s incidence curve. Several observations stand out from Figure 1.
1. For 11 of the 14 registries, the highest annual incidence over the two-decade period occurred in the most recent year (2019). Thus incidence rates are trending upwards in all but the populations covered by the San Jose, Utah and Lousiana registries.
2. In 2019, Kentucky and Iowa registries reported about 30% higher incidence than the 14 registries taken together, and 75% higher than the registries with the lowest incidence (San Jose, Utah and New Mexico.)
3. Four of the 5 registries with the lowest incidence are in California.
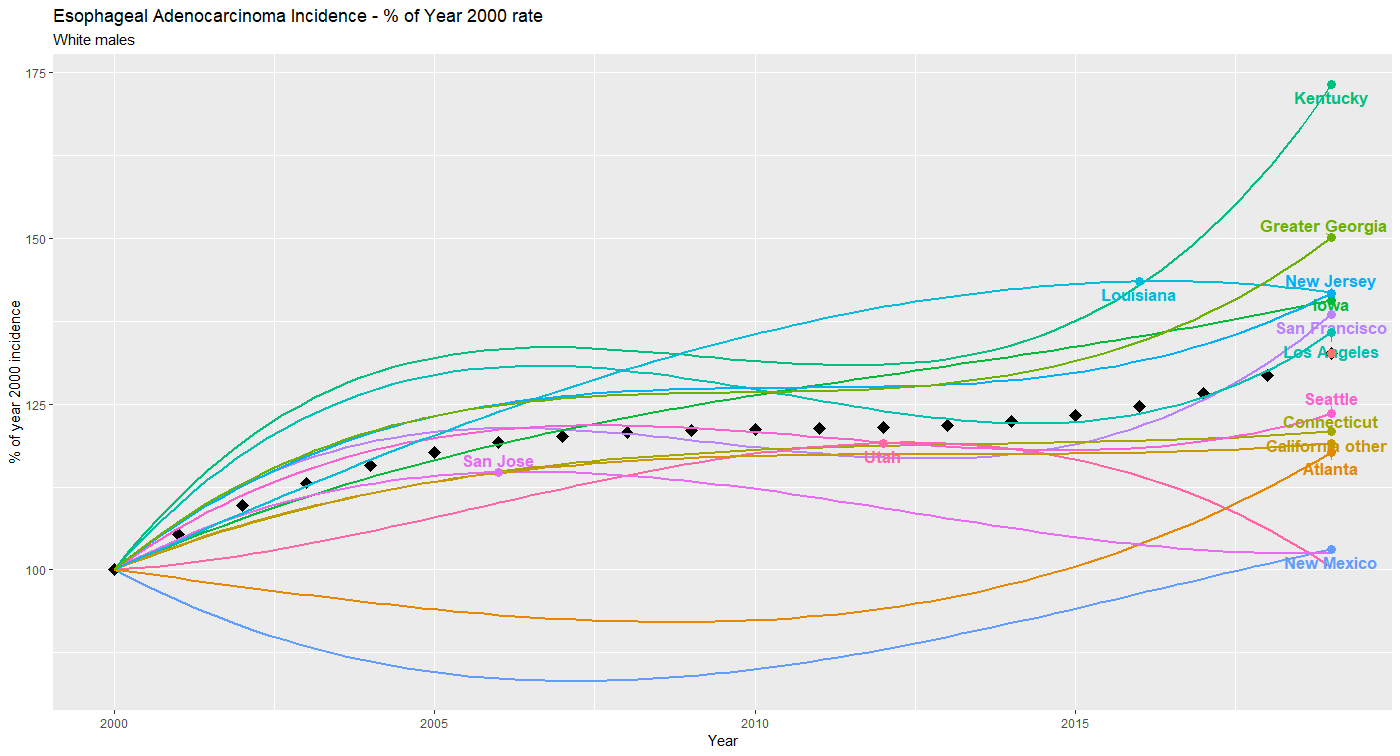
Figure 2 presents the same data, but with incidence for each registry standardized to the (smoothed) rate in the year 2000, thus focusing on changes in rates rather than absolute annual incidence. From this figure it can be seen that:
1. Kentucky had a more rapid increase in EA incidence (about 70%) than any of the other registries, with the greater Georgia registry next with about a 50% increase.
2. No registry reported a decrease in (smoothed) incidence since 2000, although the trend in Utah suggests that this will occur soon.
3. While the absolute rates in Iowa are among the highest (Figure 1), the change in incidence has been largely similar to other registries.
In summary, the increase in EA incidence in white males over the past two decades documented in last week’s post do not appear to be driven by one or two of the cancer registries, but rather are observed to a greater or lesser extent in almost of them. If these trends continue, investigation into underlying causes of the higher rates and more rapid increases in Kentucky, Iowa and to a lesser extent, New Jersey, along with the lower rates in San Jose and Utah, may shed much-needed light into the epidemiology EA.